






Many customer product information groups at Ericsson are dependent on organization and product areas. Ericsson delivers customer product information continuously and in several tracks for a large number of software and hardware products.
Ericsson has a legacy base of information content to be updated but also many new products requiring customer product information. Most content is in DITA format, but does exist in other formats like Excel or PDFs. The other formats have no impact on the reuse rates for DITA.
Ericsson Reuse Expectations
- Large potential for reuse in the information content for Ericsson products
- Continuous deliveries for many products requires efficient ways of working
- Higher quality in the content
- Save both time and money
Ericsson measured reuse in different ways to get a complete view both on the reuse in their content content, and to see what potential reuse they had.
Potential reuse:
- Measures the reuse potential in output/publication content in a defined content publication
Existing reuse:
- Source compared to outputs
- References-based reuse KPI in CCMS
- Measure what reuse they have in comparing source content to delivered content
- Measure what reuse they have directly in the content in the development tool
- Reuse KPI in the MadCap IXIA CCMS
Conclusions
- Available in IXIA CCMS directly to Ericsson users
- Measures on the content in the system (always the latest content)
- Large organizations can use the same method and have similar measurements that are comparable
- Does not consider conditionalized content
Output: Reuse Report
Reports can be created for different selections of content
- The reuse report is exported and saved as a tab-delimited file (.tsv). Can be opened in Excel.
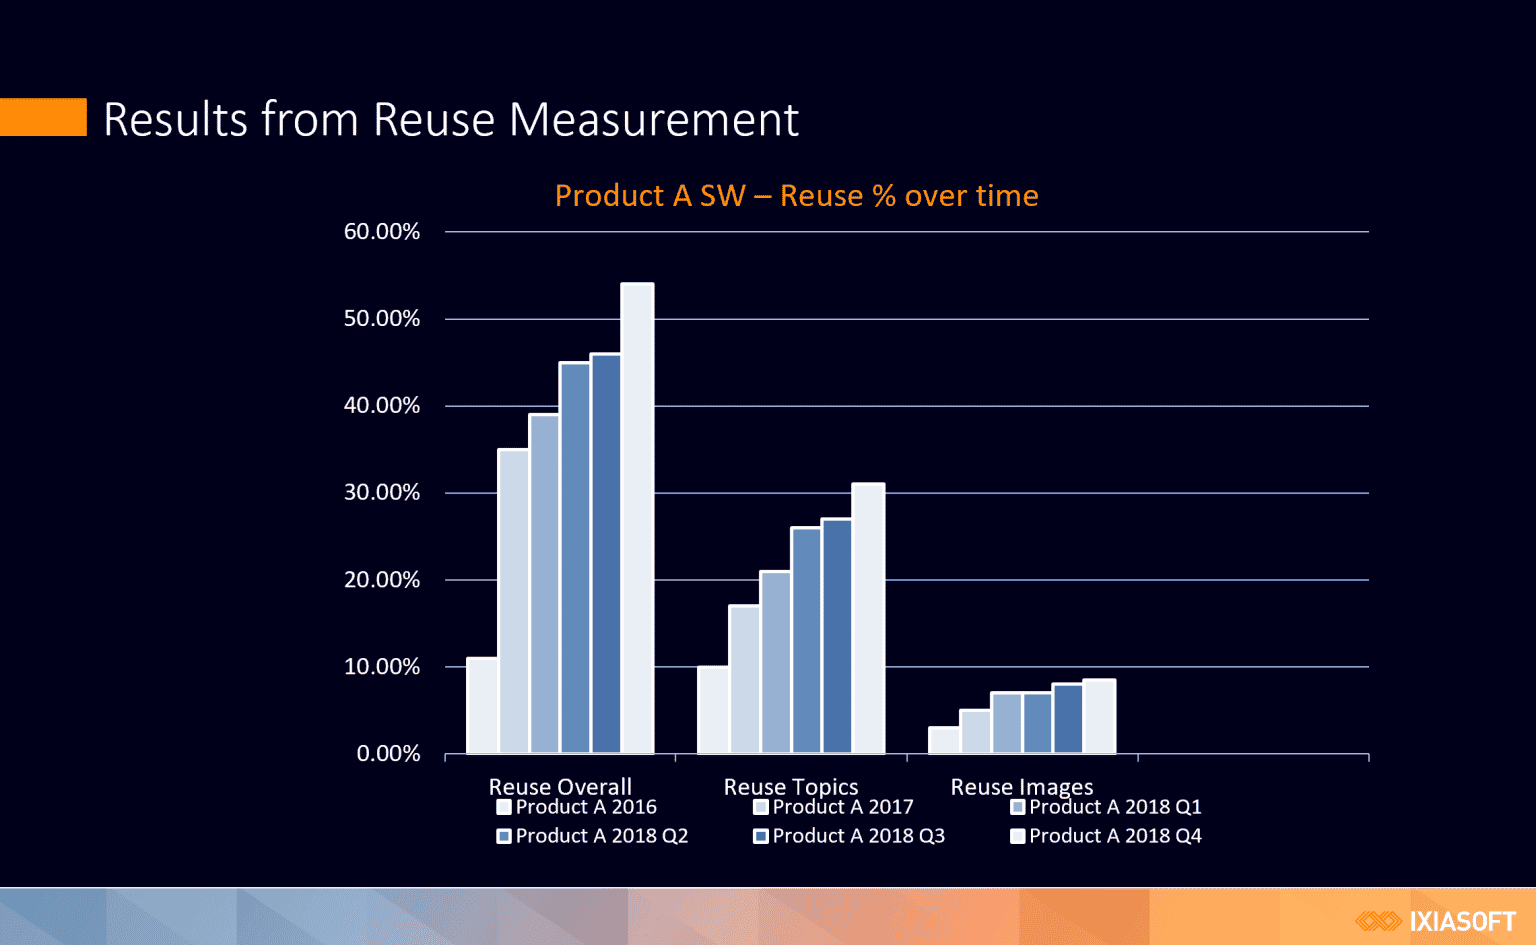
Report Contains:
The reuse is measured as a relationship (%) between unique ID references in the selected content.
- Reuse % Overall for all objects referenced by selected bookmaps
- Reuse % of Topics for all topics referenced by selected bookmaps
- Reuse % of Images for all images referenced by selected bookmaps
- Reuse % of Conref for all referable content referenced by selected bookmaps
- Name of selected bookmaps (not for selected versions)
- Full path to DRM version file (Product/Version)
Key Takeaways
- Know what you are measuring and why
- Realize that it may take a few years before you have reliable information
- Measuring reuse in the short term can be helpful in determining the usefulness of training
- Always analyze the reuse results carefully and understand what impacts the measurements before changing anything
- Find a balance between how to reuse in your content and maintainability
Want to learn more? Get the recording of our webinar, IXIAtalks: Episode 4, here.